


What is Spend Management?
Spend management, also known as spend analysis, examines current and past expenditures to cut costs, boost efficiency, and enhance supplier and sourcing relationships. This involves collecting spending data from multiple sources, cleaning and categorising it, and then analysing the information to understand the organisation's spending habits and identify areas for improvement.
By conducting spending analysis, organisations like yours can answer vital financial questions such as:
- What are we spending money on?
- Who are our key vendors?
- Are we receiving value for our money?
- Are there more cost-effective procurement options?
As businesses grow, it's essential to handle expenses wisely for lasting success. Keeping a close eye on spending and finding ways to spend better can really help the bottom line and keep finances healthy in the long run.

What are the KPIs for Spend Management?
The Key Performance Indicators (KPIs) for Spend Management are tools used to measure and evaluate a company's spending to ensure effective financial management. These metrics help businesses control costs, optimise spending, and improve overall financial performance.
KPI #1: Burn Rate
Understanding Burn Rate
Burn rate is the speed at which a company depletes its cash reserves to cover operating expenses before generating positive cash flow from operations. Monitoring burn rate is particularly crucial for startups, as it indicates how long the company can sustain operations before requiring additional funding.
Calculating Burn Rate
Total Monthly Expenses: Calculate all operating expenses for a month.
Burn Rate Formula:
Burn Rate = Total Cash Reserves/Monthly Expenses
Suppose a startup has S$500,000 in cash reserves and monthly expenses of S$50,000.
The burn rate would be:
Burn Rate = 500,000/50,000 = 10 months
This means the startup can continue operating for 10 months before it needs to secure additional funding.
How does knowing Burn Rate Help Your Business?
- Financial Planning: Understanding the burn rate helps you forecast how long your cash reserves will last. This is crucial for planning future fundraising efforts and operational budgets.
- Cash Flow Management: It allows you to monitor and manage cash flow effectively, ensuring sufficient funds to cover ongoing expenses without running out of cash unexpectedly.
- Strategic Decision Making: Knowledge of burn rate influences strategic decisions such as expansion plans, hiring, and investment in growth initiatives. It clarifies whether spending needs to be scaled back or additional funding sought.
- Investor Confidence: Investors often assess burn rates to gauge their financial health and sustainability. A manageable burn rate indicates prudent financial management and enhances investor confidence.
- Operational Efficiency: Analysing burn rate helps identify inefficiencies and opportunities for cost reduction, improving overall operational efficiency and profitability.
Addressing a High Burn Rate
- Reduce Costs: Identify and eliminate non-essential expenses to conserve cash.
- Increase Revenue: Increase sales and revenue generation to improve cash inflows.
- Extend Runway: Seek additional funding or renegotiate terms with creditors to ensure longer operational viability.
- Re-evaluate Strategy: Assess and refine business models and strategies to enhance efficiency and reduce the burn rate.
KPI #2: Budget Variance
Understanding Budget Variance
Budget variance is the difference between the budgeted amount of expense or revenue and the actual amount. It provides insights into whether financial performance aligns with the planned budget, which is crucial for effective project planning and forecasting.
Calculating Budget Variance
Budget Variance Formula:
Budget Variance = Actual Spending − Budgeted Spending
Variance Percentage: Variance Percentage = (Budget Variance/Budgeted Spending)×100
Suppose a project is budgeted at S$100,000, but actual expenses total S$110,000. The budget variance would be:
Budget Variance=110,000−100,000=10,000
The variance percentage would be:
Variance Percentage=(10,000/100,000)×100=10%
Interpretation
This indicates a 10% overspend compared to the planned budget for the project.
How Knowing Budget Variance Help Your Business?
Budget variance helps in planning and forecasting projects by:
- Identifying Variances: Highlighting discrepancies between planned and actual spending allows project managers to pinpoint areas where costs exceed expectations.
- Adjusting Future Budgets: Insights from budget variance enable adjustments to future project budgets to ensure more accurate financial planning.
- Improving Forecasting: Enhancing forecasting accuracy by learning from past variances helps better anticipate and manage project costs.
- Optimising Resource Allocation: Understanding budget variances aids in optimising resource allocation, ensuring resources are allocated efficiently to achieve project goals within budget constraints.
Addressing High Budget Variance
- Investigate Causes: Identify the reasons behind the variance.
- Adjust Budget: Modify future budgets to reflect more accurate predictions.
- Improve Forecasting: Enhance forecasting techniques and accuracy.
- Control Costs: Implement stricter cost control measures.
KPI #3: Spend by Category
Understanding Spend by Category
Spend by category involves breaking down your company's expenses into distinct categories to gain insights into financial allocations and optimise spending strategies. This process allows you to meticulously analyse where your business allocates its funds and make informed decisions to enhance efficiency and profitability.
Types of Spend by Category
- Marketing Expenses: Track expenditures related to advertising campaigns, digital marketing initiatives, and promotional materials. For instance, calculating the total spend on online ads and comparing it to the overall marketing budget helps assess campaign effectiveness.
- Travel Costs: Monitor expenses associated with business travel, including airfare, hotel stays, car rentals, and meals. Companies can manage travel budgets more efficiently by calculating travel expenditures as a percentage of total expenses.
- Salaries and Benefits: Analyse payroll costs, employee benefits, and bonuses. Calculating the portion of total expenditures allocated to salaries helps in budgeting and evaluating workforce costs.
- Software and IT Services: Track spending on software licenses, SaaS, IT infrastructure, and cloud services. Understanding the percentage of total spend dedicated to IT allows for better resource allocation and technology planning.
- Office Supplies: Monitor purchases of stationery, equipment, and office furniture. Calculating office supplies' spending helps control procurement costs and optimise inventory management.

How to Calculate Spend by Category
Identify Categories: List all expense categories, such as marketing, travel, salaries, software, etc.
Calculate Total Spend per Category: Sum up the expenses within each category over a defined period, such as monthly or annually.
Percentage of Total Spend: Calculate the proportion of spending within each category relative to the total expenses using the formula:
Category Spend percentage = (Spend by Category/Total Spend)×100
Suppose a company's total annual expenses amount to S$500,000. Marketing expenses for the same period total S$100,000.
Marketing Spend Percentage = (100,000/500,000)×100 = 20%
Interpretation:
The company dedicates 20% of its total expenditures to marketing activities.
This insight helps evaluate marketing strategies' effectiveness and adjust budgets accordingly for optimal ROI.
How Knowing Spend by Category Help Your Business?
Understanding spend by category provides several benefits for businesses:
- Cost Management: It enables you to identify areas of high expenditure, such as marketing or operational costs, allowing for targeted cost management strategies.
- Budget Allocation: By knowing how much is spent in each category, you can allocate budgets more effectively to ensure resources are distributed where they are most needed.
- Strategic Decision Making: It informs your strategic decisions by highlighting which categories contribute most to expenses guiding adjustments in investment priorities or operational strategies.
- Performance Evaluation: You can assess the effectiveness of different spending categories in achieving business objectives, aiding in performance evaluation and goal setting.
- Optimisation Opportunities: It helps you identify opportunities for optimisation, such as negotiating better deals with suppliers or implementing cost-saving measures in high-expenditure areas.
- Forecasting and Planning: Knowledge of spend by category facilitates accurate forecasting and long-term planning, supporting your financial stability and growth initiatives.
KPI #4: Monthly Expense Trend Line
Understanding Expense Trend
Expense trend analysis involves tracking your company's spending over time, typically monthly. It provides valuable insights into patterns, seasonality, and expenditure trends.
How to Calculate Expense Trend
Monthly Expense Data: Gather detailed monthly expense data spanning a defined period, such as one year or more.
Plot Trend Line: Utilise graphing tools or software to plot expenses chronologically to visualise trends and fluctuations over time. Collect detailed expense data for each month over the past year.
Plotting the Monthly Expense Trend Line:
Use graphing tools or software to create a trend line based on the monthly expenses recorded.
Suppose the monthly expenses for your company over the past year show varying trends:
January: S$50,000
February: S$55,000
March: S$48,000
April: S$60,000
May: S$58,000
June: S$65,000
July: S$70,000
August: S$68,000
September: S$55,000
October: S$58,000
November: S$62,000
December: S$75,000

Interpretation:
- Planning for High-Spend Periods: Notice a peak in spending during July and December, likely due to seasonal factors or specific business needs. Plan budgets and allocate resources accordingly for these months.
- Identifying Cost Reduction Opportunities: Identify months like March and September where spending is lower. Use these periods to implement cost-saving measures or negotiate better terms with vendors.
How Knowing Expense Trends Help Your Business?
Understanding expense trends provides several benefits for your business:
- Financial Planning: It allows you to forecast future expenses more accurately based on historical data, enabling better budgeting and cash flow management.
- Identifying Seasonal Patterns: Recognising seasonal fluctuations in expenses helps you prepare for peak spending periods and adjust resources accordingly.
- Strategic Decision Making: It informs strategic decisions by highlighting trends and patterns and guiding adjustments in operational strategies or investment priorities.
- Cost Management: By identifying trends where expenses are consistently high or low, you can implement targeted cost-saving measures to improve profitability.
- Improving Efficiency: Analysing expense trends helps optimise resource allocation, streamline processes, and identify areas where efficiencies can be enhanced.
- Benchmarking Performance: Comparing current expense trends with industry benchmarks or past performance allows you to assess your business's financial health and competitiveness.
KPI #5: Return on Ad Spend (ROAS)
Understanding Return on Ad Spend (ROAS)
Return on Ad Spend (ROAS) measures the revenue generated for every dollar spent on advertising. It is a crucial metric within the broader Return on Investment (ROI) framework, specifically focusing on the effectiveness of advertising expenditures.
How to Calculate ROAS
ROAS Formula: Calculate ROAS by dividing the revenue generated from ads by the cost of those ads.
ROAS = Revenue from Ads/Cost of Ads
So, let's say your business invested S$10,000 in online advertising campaigns last month.
These campaigns generated a total revenue of S$50,000 in sales directly attributable to the ads.
ROAS Calculation: ROAS = S$50,000/S$10,000 = 5
Interpretation:
- For every singapore dollar spent on advertising, your business generated S$5 in revenue.
- A ROAS of 5 indicates that your advertising campaigns are effective, delivering a positive return on investment.
- You can allocate more budget to campaigns or channels that demonstrate a higher ROAS, such as focusing on platforms or strategies that consistently yield better returns.
- Use the insights gained from high ROAS campaigns to reinvest in marketing efforts. This reinvestment can fuel further growth and increase revenue generation.
How Knowing Return on Ad Spend (ROAS) Helps Your Business?
Understanding Return on Ad Spend (ROAS) provides several benefits for you as a business owner:
- Optimise Ad Spend: Identify high-performing advertising campaigns or channels yielding favourable ROAS. Allocate more budget to these successful ads to maximise returns.
- Scale Marketing Efforts: Use the insights from ROAS to scale up your marketing efforts. Reinvest profits from high ROAS campaigns into expanding your advertising reach or frequency.
- Investment Flywheel: Embrace the concept of the ROAS Investment Flywheel, where profits generated from successful ad campaigns are reinvested into further advertising initiatives. This continuous cycle aims to amplify returns and accelerate growth.
- Diversify Channels: Explore diversifying your advertising channels based on ROAS performance. Reallocate funds to channels demonstrating potential for higher returns or better audience engagement.
- Testing and Optimisation: Test and optimise your ad creatives, messaging, targeting, and landing pages based on ROAS insights. Use data-driven decisions to refine your campaigns and improve overall performance.
- Market Expansion: Consider using increased ROAS to fund market expansion strategies. Invest in entering new geographic markets or targeting new customer segments with the potential for high returns.
- Customer Acquisition: Use ROAS metrics to refine your customer acquisition strategies. Allocate resources to attract and convert high-value customers who contribute significantly to overall profitability.
- Data Analysis and Attribution: Enhance your data analysis capabilities to better attribute sales and conversions to specific ad campaigns. This helps in accurately measuring ROAS and making informed reinvestment decisions.
- Business Development: Use ROAS as a benchmark for assessing the effectiveness of your advertising investments in achieving broader business goals. Reinvest in initiatives that align with strategic objectives and long-term growth plans.
Why Real-Time Business Intelligence is Crucial?
Real-time business intelligence (BI) is crucial because it provides up-to-date insights into your business operations, enabling timely decision-making and proactive management.
Here's why it matters:
- Immediate Insights: Real-time BI offers instant access to critical data and analytics, allowing you to monitor key performance indicators (KPIs) as they happen. This agility is essential for responding swiftly to market changes, customer trends, or operational issues.
- Enhanced Decision-Making: With real-time data at your fingertips, you can make informed decisions quickly and confidently. Whether it's adjusting marketing strategies, optimising inventory levels, or identifying new growth opportunities, real-time BI ensures you stay ahead of the curve.
- Improved Operational Efficiency: By monitoring operational metrics in real time, you can identify inefficiencies, streamline processes, and allocate resources more effectively. This efficiency not only reduces costs but also enhances overall productivity.
- Competitive Advantage: Real-time BI enables you to outpace competitors who rely on outdated or delayed information. It empowers your team to act on insights promptly, gaining a competitive edge in dynamic and fast-paced markets.
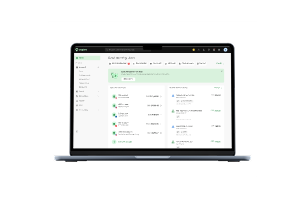
How Aspire Spend Management Can Help?
Aspire's Spend Management enhances your ability to leverage real-time BI by:
- Centralised Data Management: Aspire's expense management feature consolidates spending data from various sources into a unified system, providing a real-time view of expenses and financial health.
- Organised Spending: Assign corporate cards for specific purposes, such as subscriptions, marketing, or software purchases. This streamlines expenses, saving you time and reducing complexity.
- Advanced Analytics: Customise dashboards and reports with Aspire's tools. Monitor spending patterns, ensure budget compliance, and uncover cost-saving opportunities instantly.
- Empower Your Team: With Aspire's multi-user access, your team can spend wisely while effortlessly maintaining oversight. This promotes accountability and simplifies expense tracking.
- Automation and Alerts: Automate workflows and receive real-time alerts. Stay proactive with notifications about budget changes, vendor issues, or policy violations, ensuring timely action and risk management.
- Stay Informed Anywhere: Stay informed about your finances in the office or remotely. Aspire's mobile app makes monitoring transactions and managing expenses easy, keeping your business operations smooth and efficient.
- Maximise Your Savings: Earn 1% cashback on eligible SaaS and marketing expenses with every Aspire card transaction. Reinvest your cashback earnings to drive growth and optimise your budget effectively.
Open a business account with us today and unlock additional features in just a few minutes!


.webp)